For Graph-structured Data
Graphs are a general language for describing and analyzing entities with relations/interactions. Examples include social networks, biological networks, power grid, scene graphs, knowledge graphs, and similarity graph induced from a data matrix.
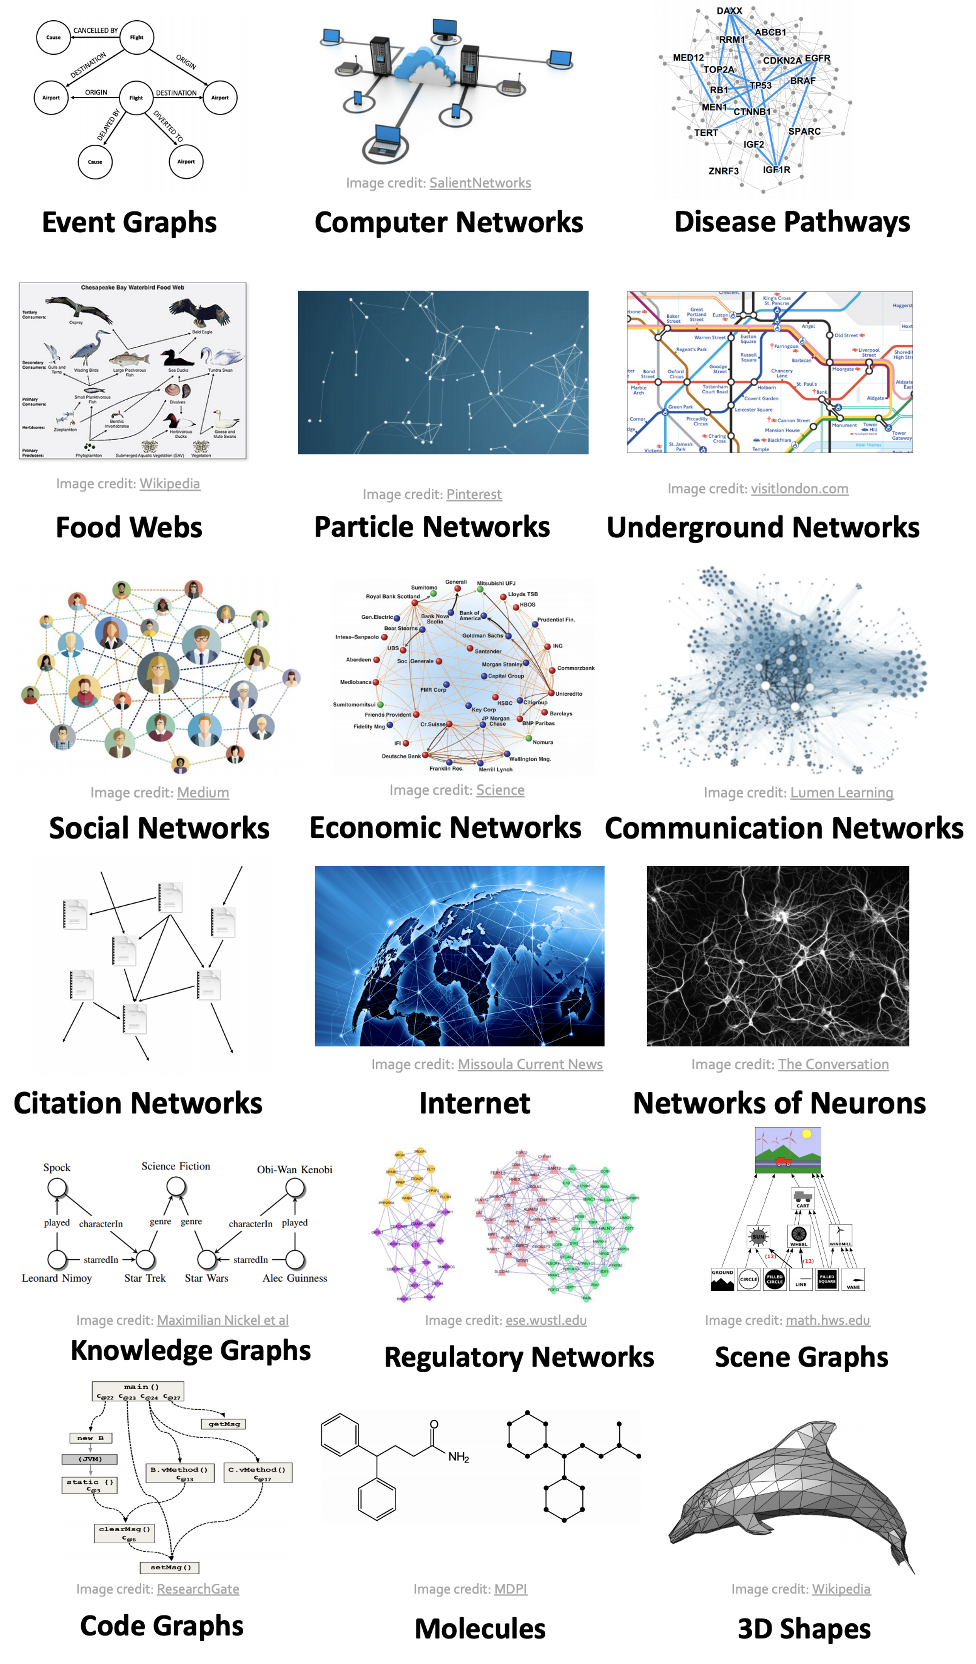
Fig. 187 Real-life graphs and networks
Why studying graphs?
Necessity
To model complex systems, we need to under stand how the underlying networks behind them.
Advantage
Complex domains (knowledge, text, images, etc) have a rich relational structure, which can be represented as a relational graph. By explicitly modeling relationships we achieve better performance!
New approaches
Modern ML models is designed for simple sequences & grids. We need new ML models to that take graphs as input, which
have arbitrary size and complex topological structure (i.e., no spatial locality like grids
no fixed node ordering or reference point
often dynamic and have multimodal features
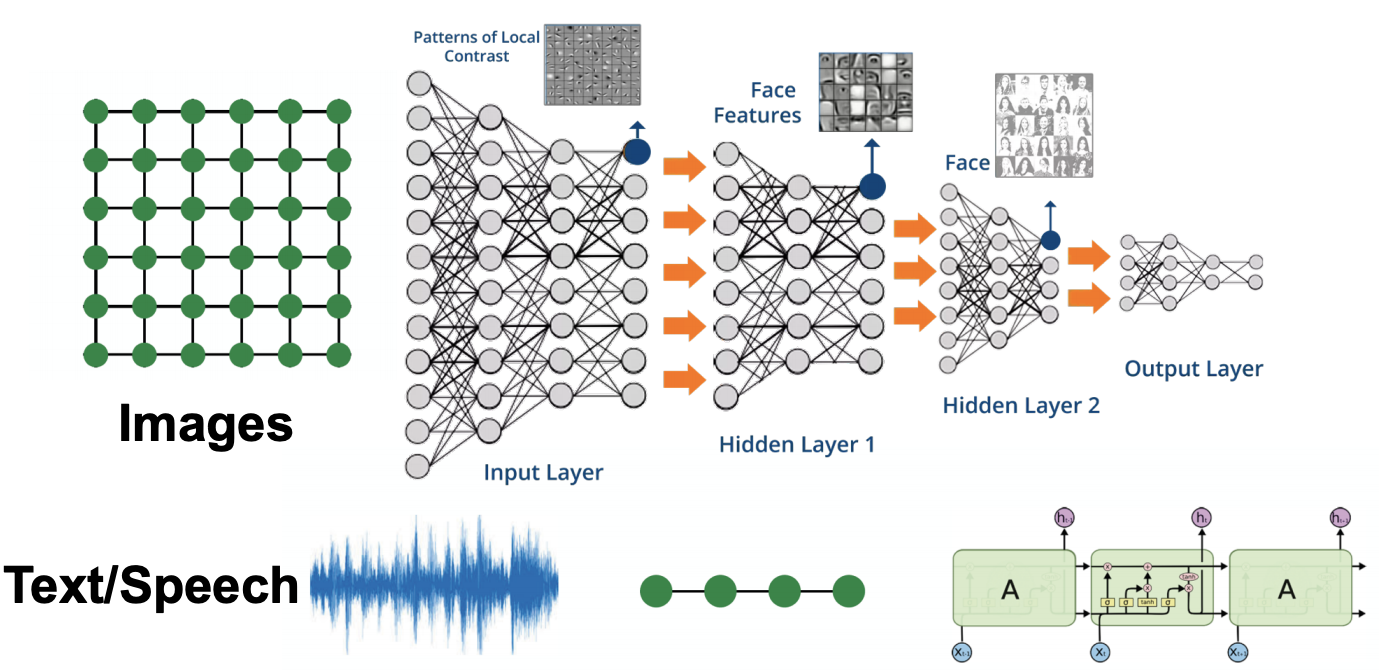
Fig. 188 Modern ML models is designed for simple sequences & grids
Tasks
Tasks can lie in different level of a graph.
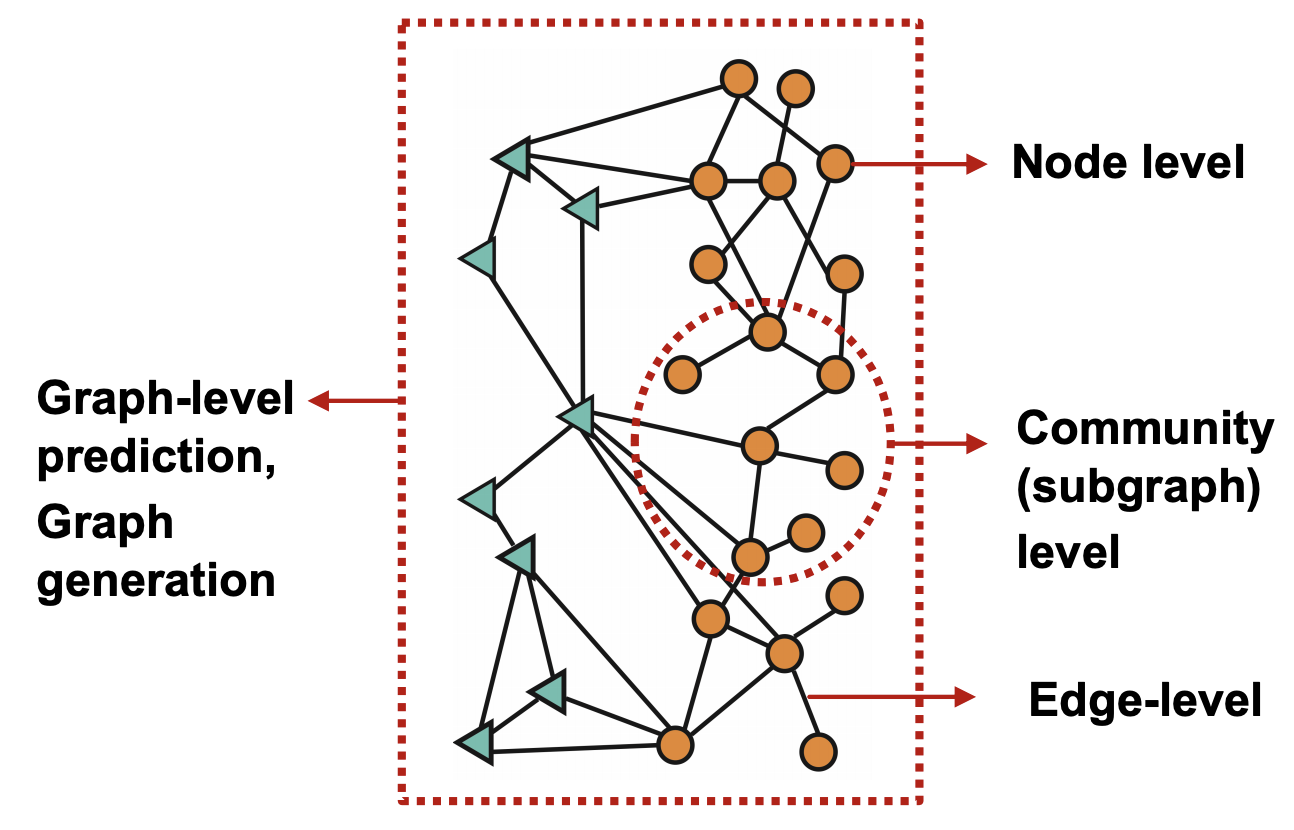
Fig. 189 Tasks taxonomy in ML for graphs
Node classification
Predict the label of a node
Example: Categorize online users / items
Node embeddings
Similar nodes on a graph are close in the embedding space
Methods: DeepWalk, Node2Vec
Link prediction
Static graphs: predict whether there are missing links between two nodes
Dynamic graphs: Given fixed \(N_v\), predict new edges in the next stage
Example: Knowledge graph completion, recommender systems, adverse side effect of drugs (impossible for real experiment)
Clustering
Detect if similar nodes form a community with densely link
Example: Social circle detection
Graph classification
Categorize different graphs
Example: Molecule property prediction
Other tasks
Graph generation: Drug discovery, nodes are atoms and edges are chemical bonds
Graph evolution: Physical simulation
Graph similarity: compare molecules
Congestion in road networks
Identify
Polarization [Political Polarization on Twitter]
Misinformation [Disinformation on the Web]
Model process of
Information cascade
Product Adoption [Cascading invitations]
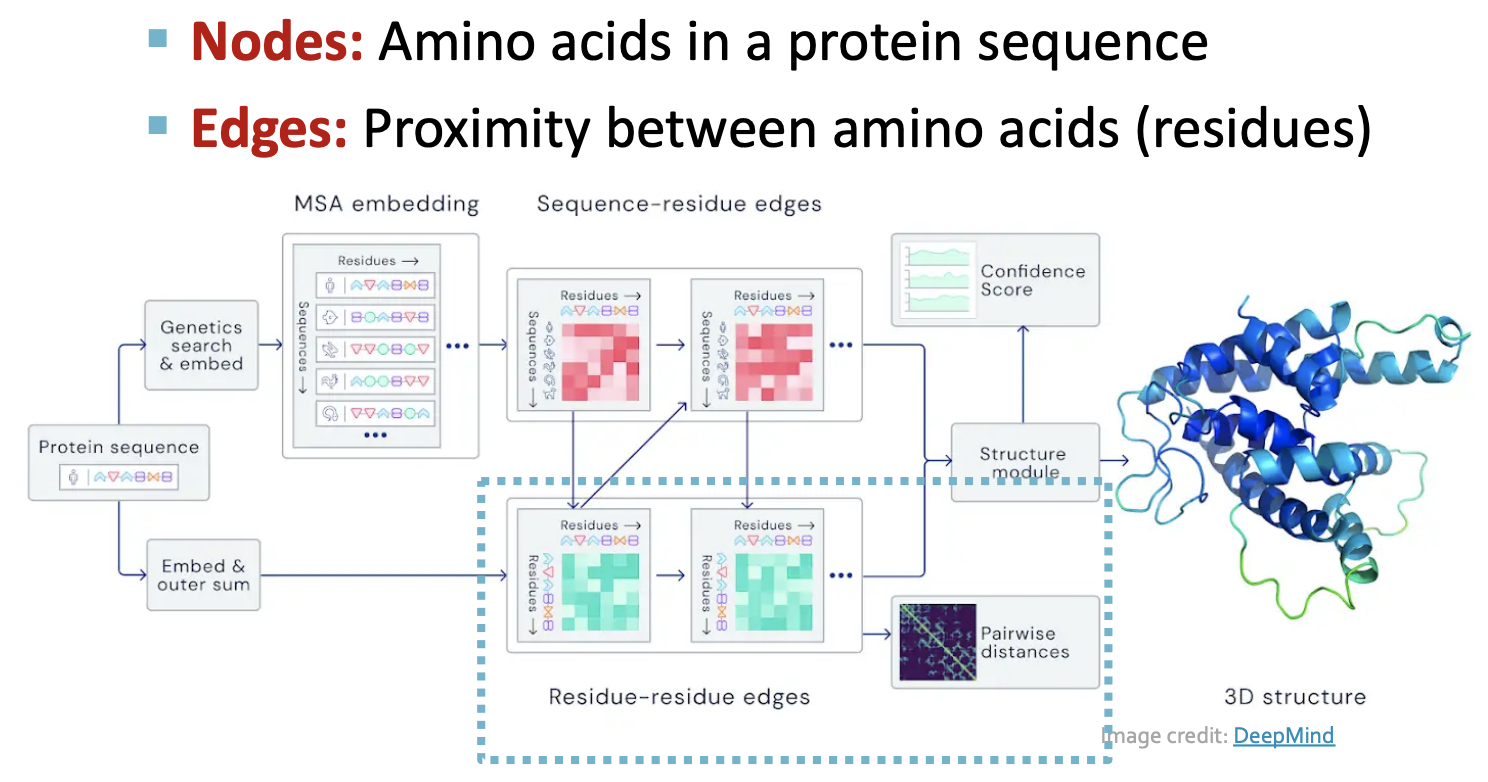
Fig. 190 Illustration of AlphaFold
Toolkit and Codebase:
Reference
ML + Graphs
Stanford CS244W: Machine Learning with Graphs [link]
Theory
More application using graphs and networks
National Research University Higher School of Economics: Structural Analysis and Visualization of Networks, Winter-Spring 2015 [link]
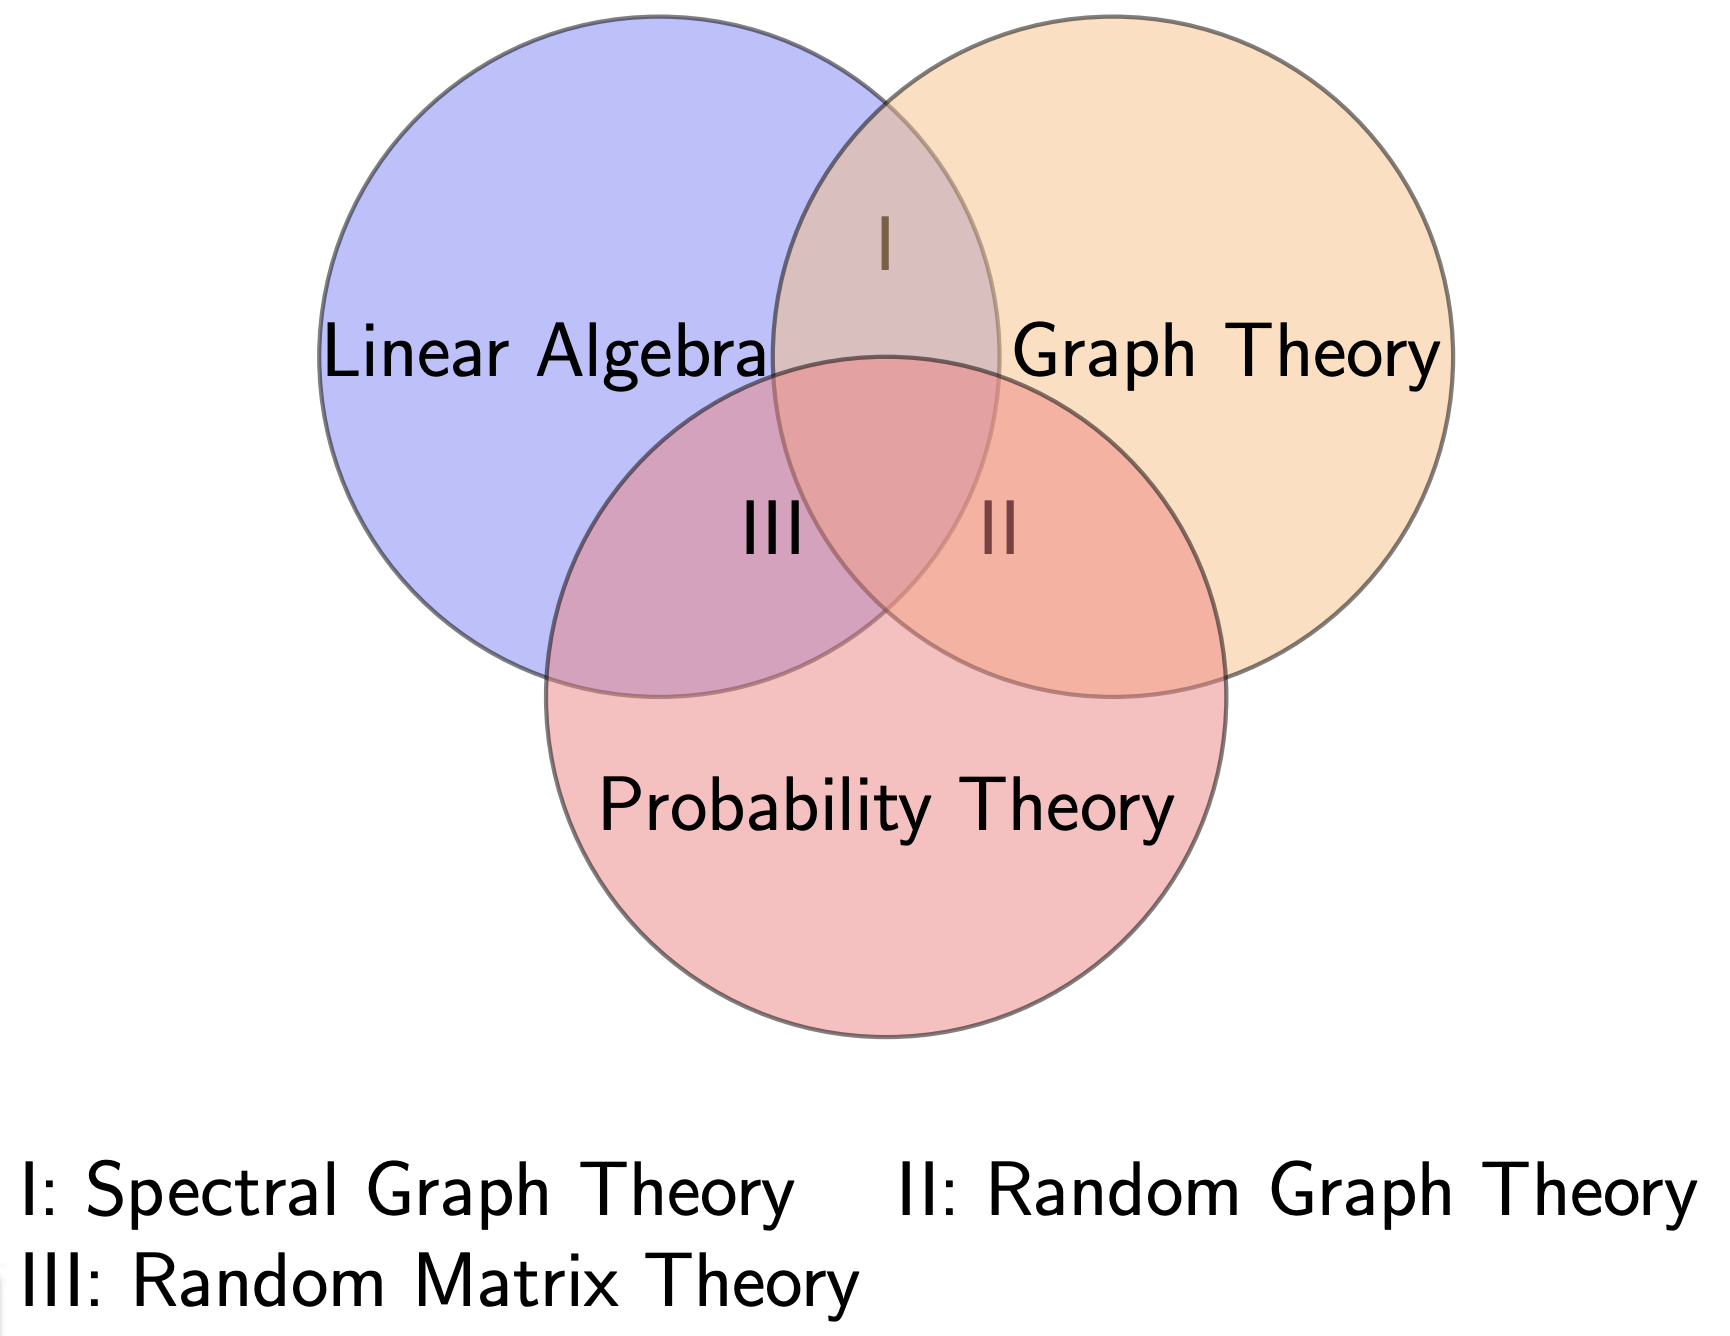
Fig. 191 Venn diagram of graph-related theories: I = spectral graph theory, II = random graph theory, III = random matrix theory. [Lingyuan 2014]