Graphical Models
Graphical models us graphical language for representing and reasoning about random variables and their distributions. The edge represents dependence structure.
For instance, hair length and height are not independent, since there is a confounding variable of gender. Given gender, they are independent. We can draw a graph to represent this.
Bayesian Networks
Bayesian networks is an acyclic directed graphical models.
Each node is a variable \(X_i\), and its parents are denoted by \(\pi(X_i)\)
Local probability function \(P(X_i \mid \pi(X_i))\)
Factorization
In a Bayesian network, the joint probability can be factorized as
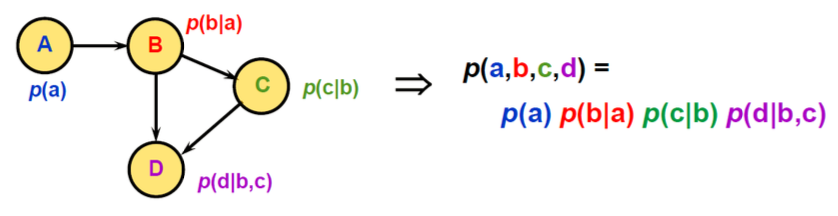
Fig. 138 Joint probability as factorization
How many numbers needed to encode the probabilities?
Suppose \(a,b,c,d\) are discrete and each have 10 values
representing \(p(a)\) requires 10 numbers (actually 9)
representing \(p(b \vert a)\) requires 100 numbers
So without factorization, to represent \(p(a,b,c,d)\) we need \(1e4\) numbers. But with factorization, we only need \(1e1 + 1e2 + 1e3 + 1e4 = 1210 \ll 1e4\). That’s the advantage of factorization.